Relative Frequencies + Discrete Variables (Q1a)
Most Chapter 7 textbook exercises give you a complete probability distribution to work from. Easy! What if you are presented only with frequencies and have to construct your own distribution? This happens on test questions. In this video I show you how to handle them.
Probability Distribution: a table, formula, or graph that describes the values of a random variable and the probability associated with these values
A discrete probability distribution has two components:
- Each possible value of X is listed
- The probability of each X occurring, P(x), is also listed
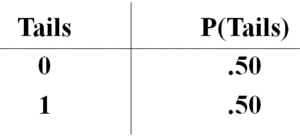
Discrete probability distributions are typically presented as tables. A simple example:

The probability of each X occurring, P(x), is equal to the frequency of that X, fx, divided by the total number of observations (n)

Test your understanding:
Quiz Summary
0 of 2 Questions completed
Questions:
Information
You have already completed the quiz before. Hence you can not start it again.
Quiz is loading…
You must sign in or sign up to start the quiz.
You must first complete the following:
Results
Results
0 of 2 Questions answered correctly
Time has elapsed
| Average score |
|
| Your score |
|
Categories
- Not categorized 0%
- 1
- 2
- Current
- Review
- Answered
- Correct
- Incorrect
-
Question 1 of 2
1. Question
A table, formula, or graph that shows all possible values a random variable can assume, together with their associated probabilities, is called a(n):
CorrectIncorrect -
Question 2 of 2
2. Question
A deck of 52 cards has four suits: hearts, spades, diamonds, and clubs. There are 13 cards in each suit. You draw one card at random from the deck. What is the probability it’s a heart?
CorrectIncorrect
